
Automated Testing of Power Profiles in Low-Power Embedded Devices
A BLE sensor node passes every lab test. Sleep current measures 4.2 µA — within spec. Battery life is projected at 18 months. Six weeks after field deployment, devices start dying in 4 to 5 months.
The culprit: a firmware update caused the device to fail re-entering deep sleep after certain connection events, leaving it idling at 800 µA continuously. Functional tests never caught it. The bench measurement captured sleep state but never captured the full operational cycle.
This is the standard story.
Why Power Profiling Is Non-Negotiable
For battery-operated devices, power consumption is not a performance metric — it is a product specification. A BLE sensor drawing 10 µA more than expected in sleep does not perform slightly worse; it delivers half the battery life.
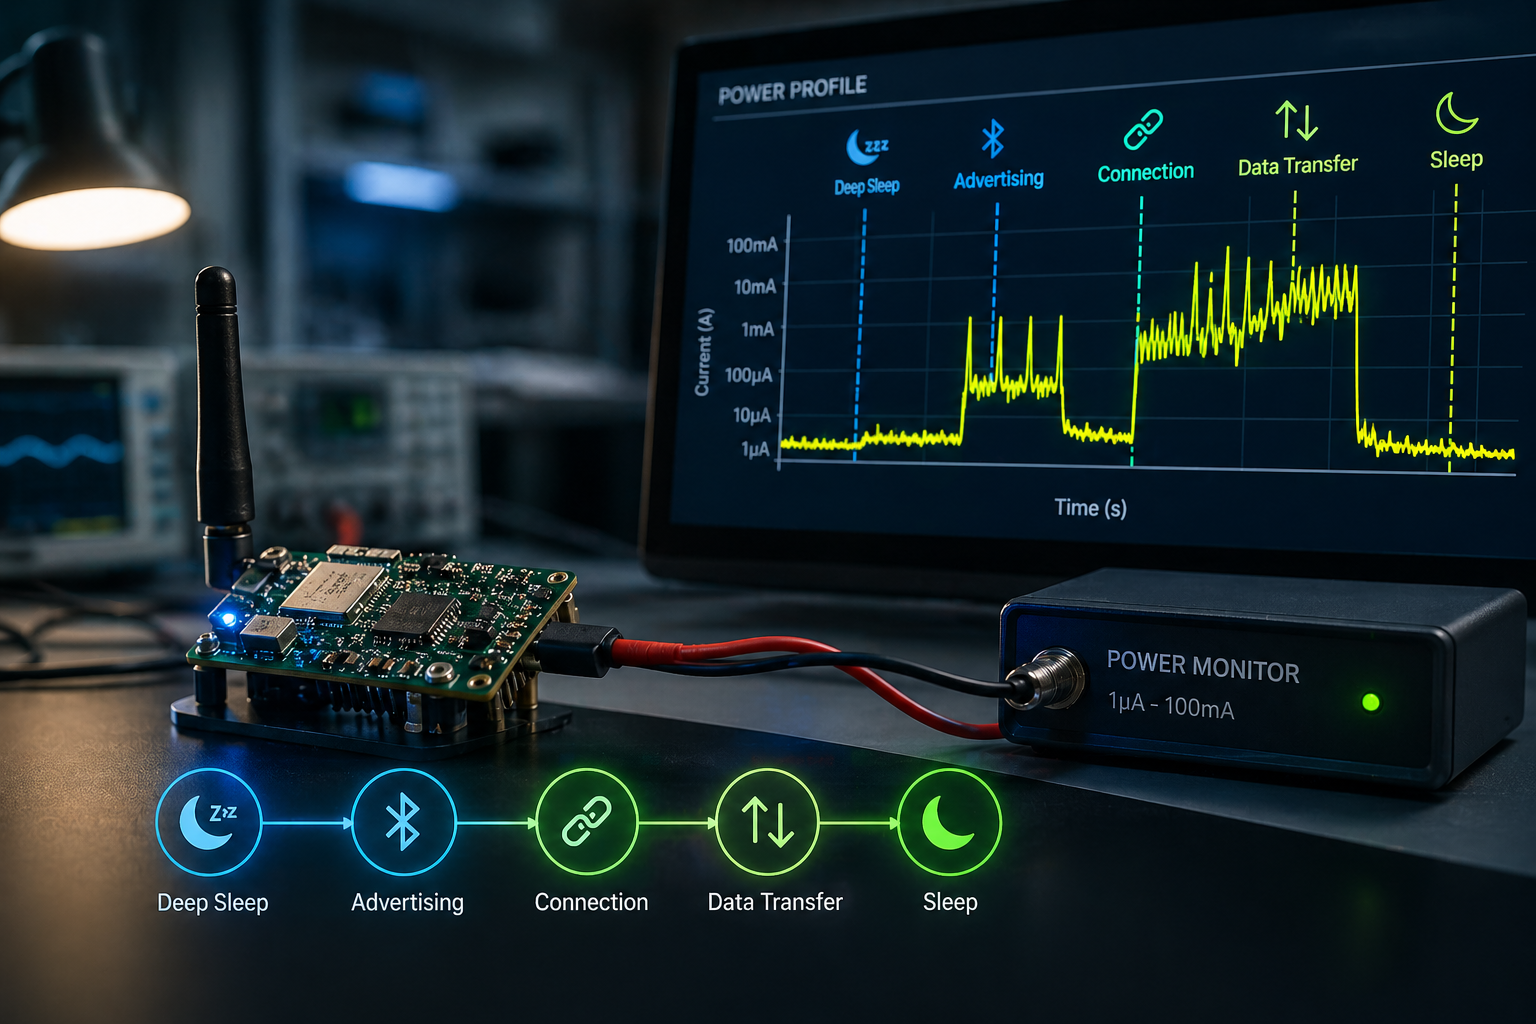
The challenge is that power consumption is not a single number. It is a dynamic profile across distinct operational states:
| State | Typical Current | What Can Go Wrong |
|---|---|---|
| Deep sleep | 1–10 µA | Peripheral not powering down; GPIO leakage; software timer blocking sleep |
| Idle | 500 µA–2 mA | Unexpected background process; clock running unnecessarily |
| BLE advertising | 5–15 mA peak | Wrong interval configuration; stack not returning to sleep cleanly |
| Connection events | 8–12 mA peak | Extended active window; missed sleep re-entry after handshake |
| Data transmission | 10–20 mA peak | Oversized payload; retransmission overhead; RF duty cycle too high |
Testing power behavior means validating each state — and the transitions between them.
Why Manual Measurement Fails
Timing resolution. A BLE advertising burst lasts 1–3 ms. The sleep-to-active transition takes under 500 µs. A standard bench setup misses these windows entirely.
Dynamic range. Peak transmission current may be 15 mA while sleep current is 4 µA. Most instruments cannot accurately capture both in a single measurement without range-switching artifacts.
No synchronization. A power trace without firmware event markers is uninterpretable. You can see current increased — but was that advertising, a sensor read, or a flash write?
No repeatability. Manual measurements capture one instance under one set of conditions. They cannot serve as a regression baseline.
TestBot: Automated Power Profile Validation
TestBot combines a Power Monitoring Test Jig with its command and control framework to produce synchronized, repeatable power profiles across firmware builds.
- Power Monitoring Test Jig measures continuous current from sub-µA to mA range without range-switching gaps. It samples at rates sufficient to resolve BLE activity windows and logs every sample with a timestamp tied to a shared reference clock.
- TestBot Command Framework drives the DUT through defined operational states — sleep, advertise, connect, transmit — via UART, GPIO, or BLE agent. At each state transition, a GPIO trigger marks the exact firmware event in the current trace. The measurement and the firmware event are correlated automatically.
- Test execution is fully parameterized. Advertising intervals, payload sizes, sleep durations, and pass/fail thresholds are defined in Excel. The same suite runs across different configurations and firmware versions without script changes.
A typical test run produces this:
| Event | Peak Current | Avg Current | Result |
|---|---|---|---|
| Deep sleep steady-state | 4.8 µA | 4.2 µA | Pass |
| BLE advertising (100ms interval) | 12.1 mA | 48 µA | Pass |
| Data transmission (20B payload) | 14.8 mA | — | Pass |
| Post-connection sleep re-entry | 380 µA | — | Pass |
Every row is generated automatically, compared against defined thresholds, and traceable to a specific firmware event.
What This Catches in Practice
- Sleep current regression — the 800 µA post-connection failure in the opening scenario shows up immediately as a failed sleep re-entry test
- Advertising interval vs power — running the suite at 20ms, 100ms, 500ms, 1000ms intervals validates the consumption curve against expected values
- Idle power leaks — a 50 µA spike every 500ms during sleep, invisible to a static measurement, is caught by continuous monitoring over a multi-second window
- Cross-build comparison — any state showing statistically significant current change between firmware versions is flagged before release
Conclusion
Power consumption in low-power embedded systems is a behavioral profile — dynamic, state-dependent, and directly tied to product lifetime. It must be tested systematically, measured against defined thresholds, and validated on every firmware build.
TestBot makes this deterministic, automated, and scalable — turning power profile validation from a manual bench activity into a build-integrated engineering discipline that catches the failures before they reach the field.